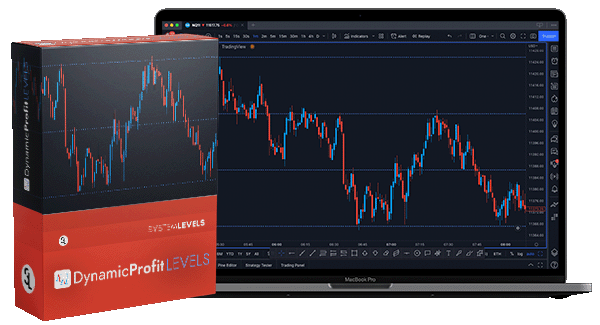
Automated Volatility Adjusting Support & Resistance
The Dynamic Profit Levels (DPL) indicator automatically plots strong support & resistance levels on your chart, making them great profit targets for your trades.
You'll Never Have To Guess When To
Close A Trade Again...
You're in a trade, it's going well and you're wondering when it's a good time to close it.
Most of the time, it's a pure guess. The Dynamic Profit Levels give you a systematic way of exiting your trades so you'll never end up guessing.
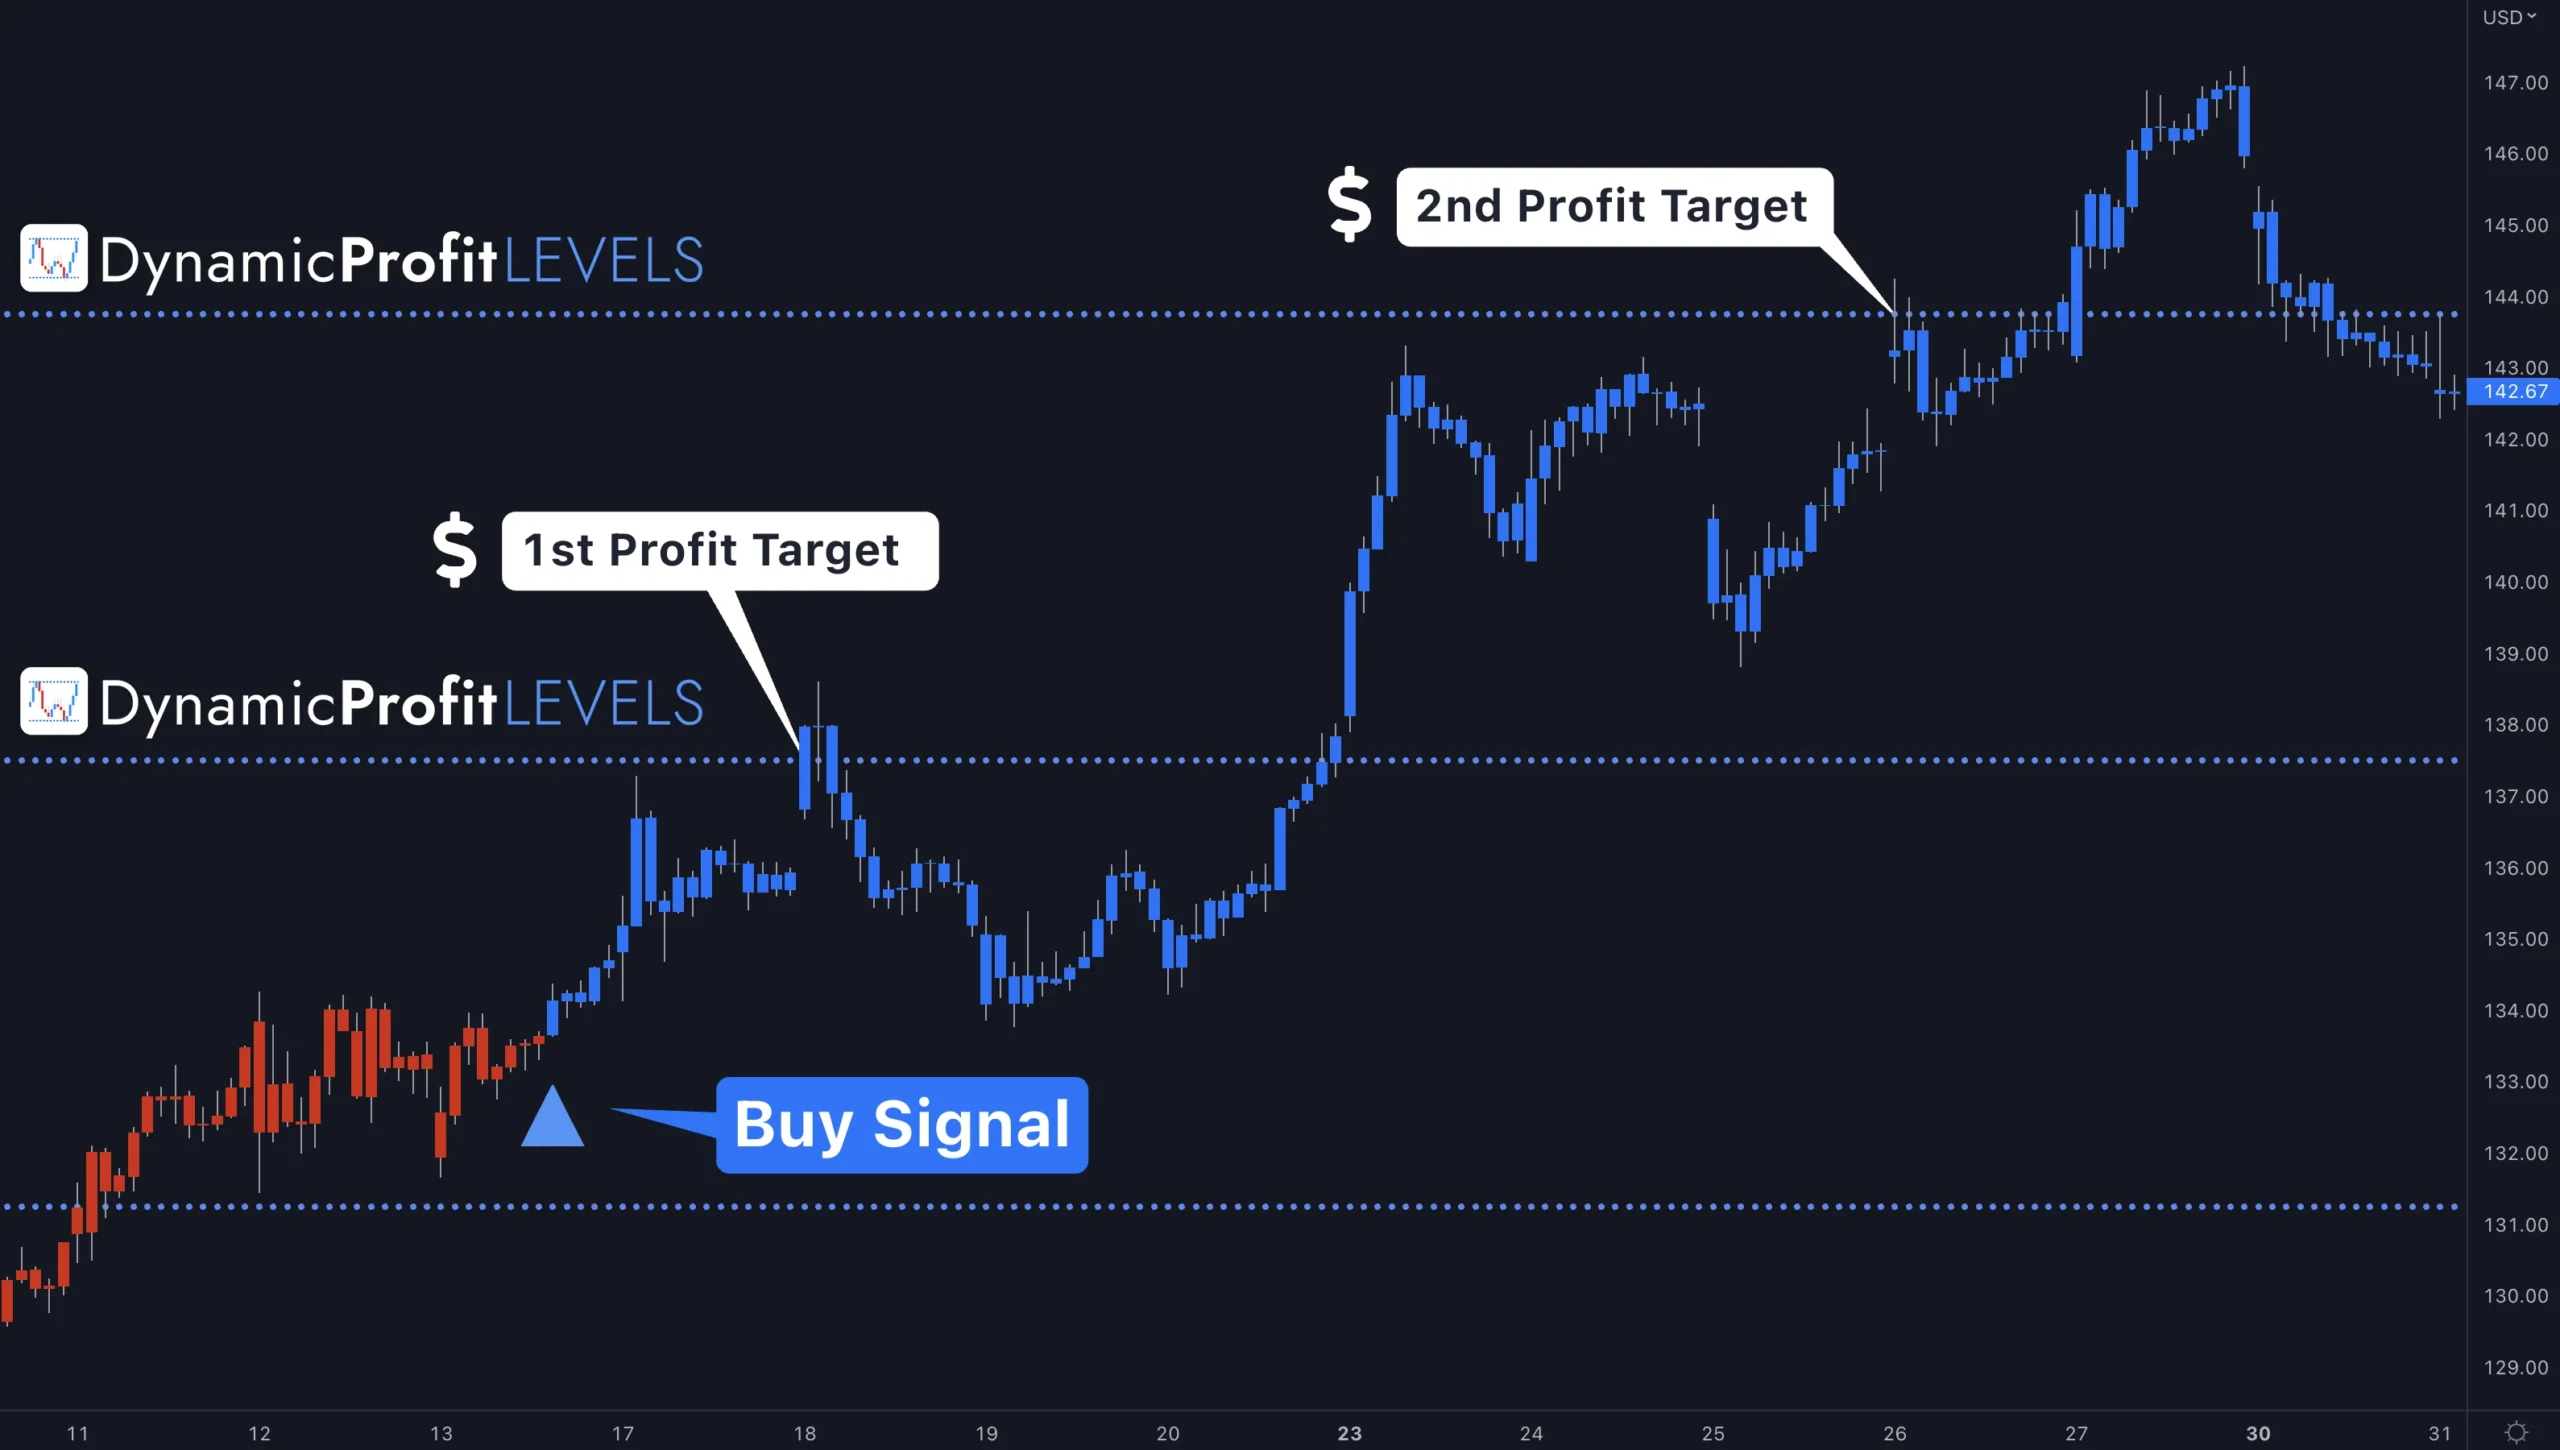
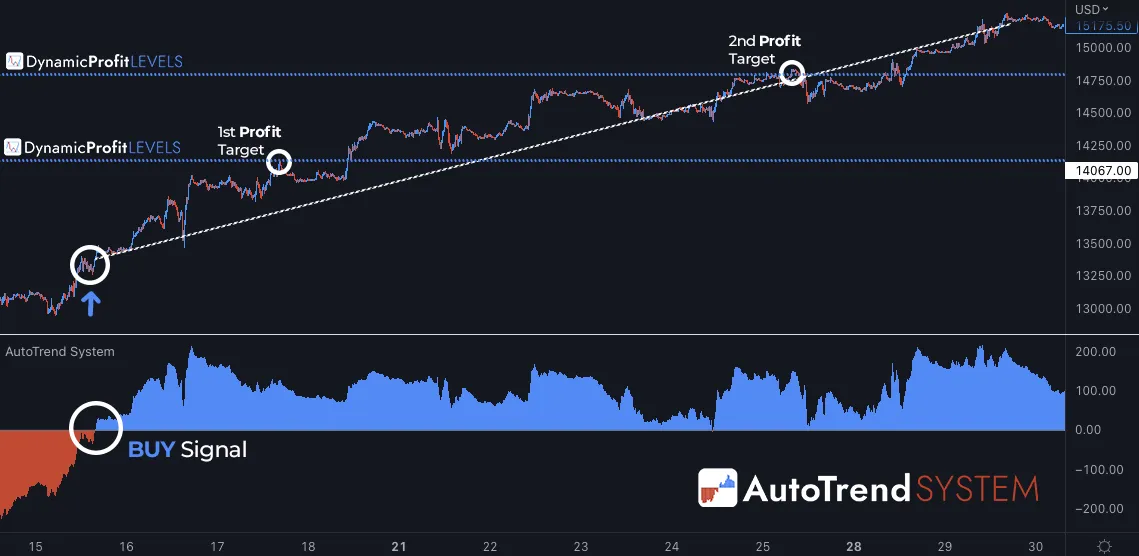
The levels themselves are mathematically calculated strong support & resistance zones. When price hits them there is a high likelihood that it will pause or reverse there, making them excellent locations to lock-in your gains.
They are always automatically calculated on any chart you place them.
1Min, 15Min, 1Hour, 1Day?
Works On Any Time Frame.
Do you like the action of day trading or maybe the calm of swing trading? How about long term investing?
No matter your time frame, the Dynamic Profit Levels work on all of them.
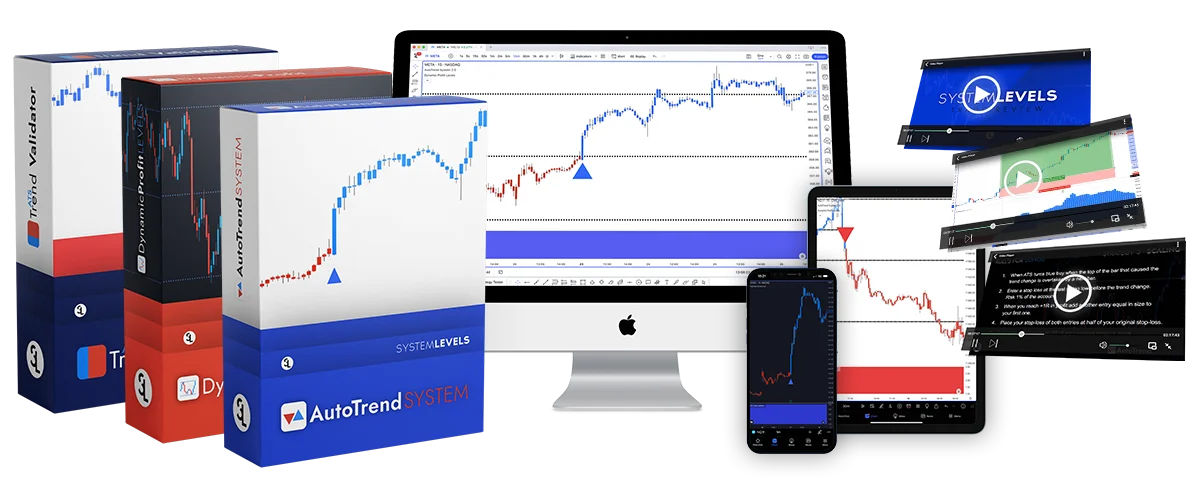
THE DYNAMIC PROFIT LEVELS INDICATOR IS PART OF THE ATS PACKAGE
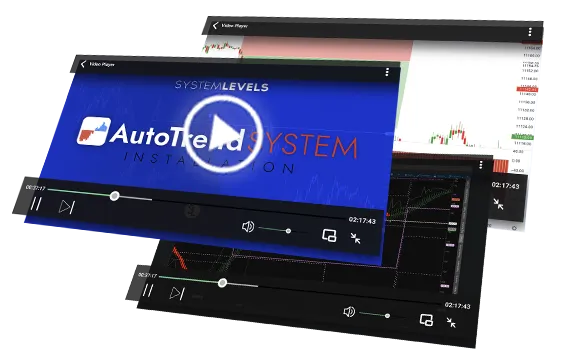
Here's What AutoTrend System Includes
Everything you need to start making smart trades right away.
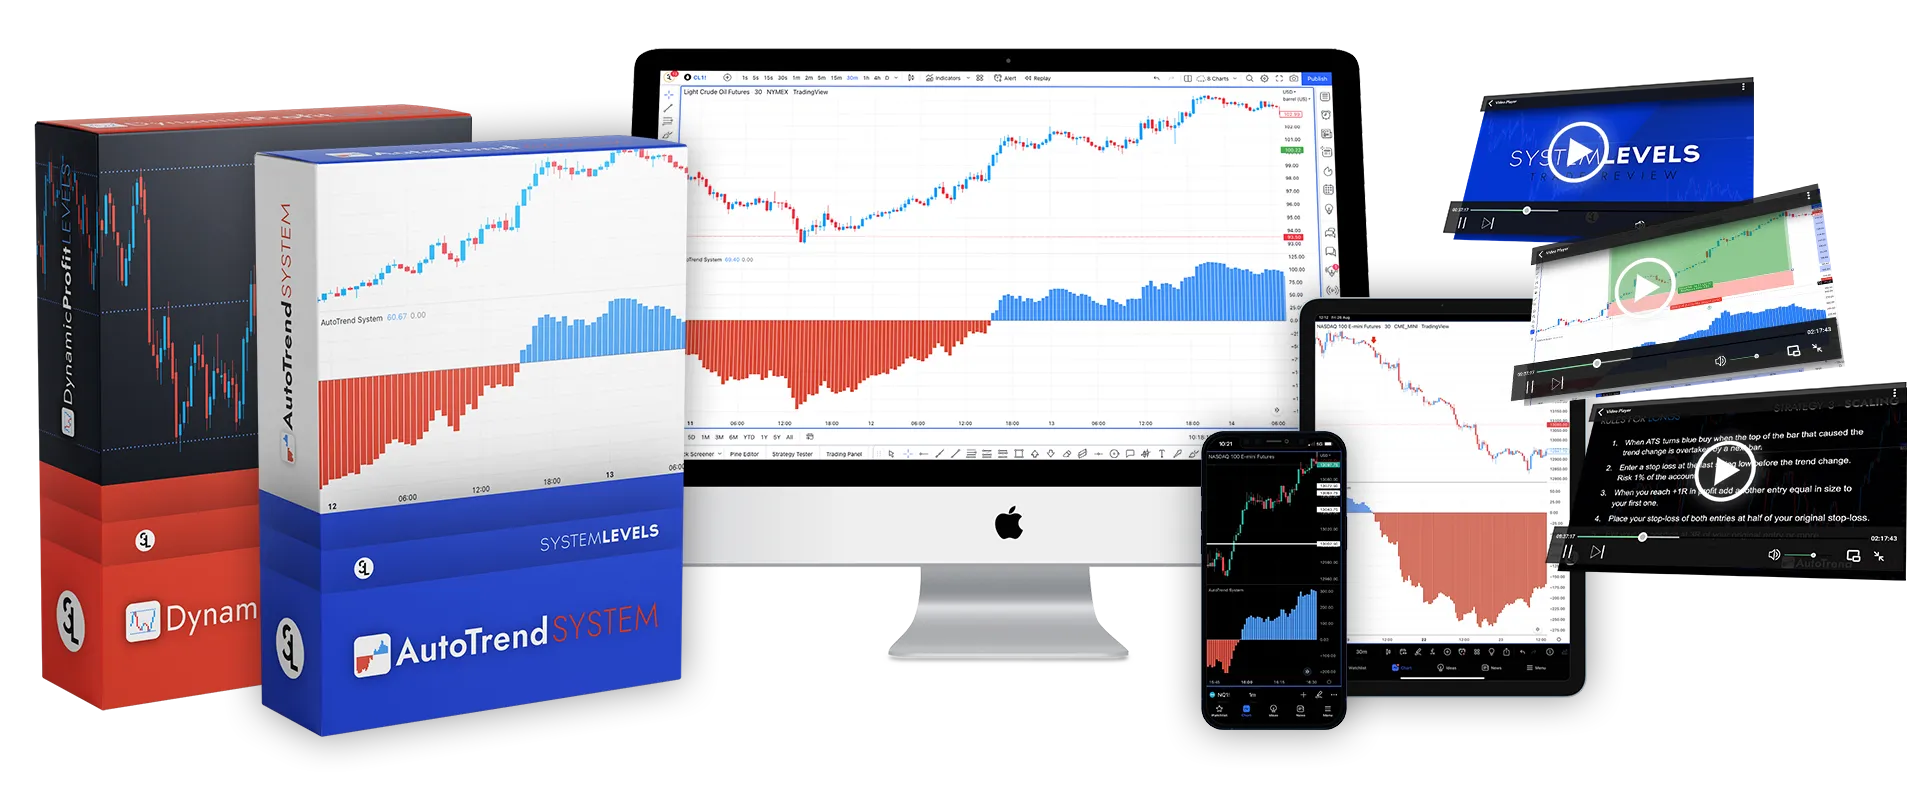
1 -
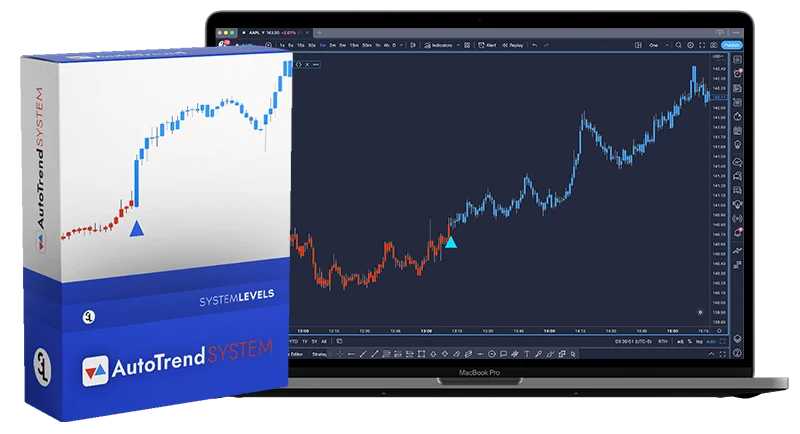
The Original
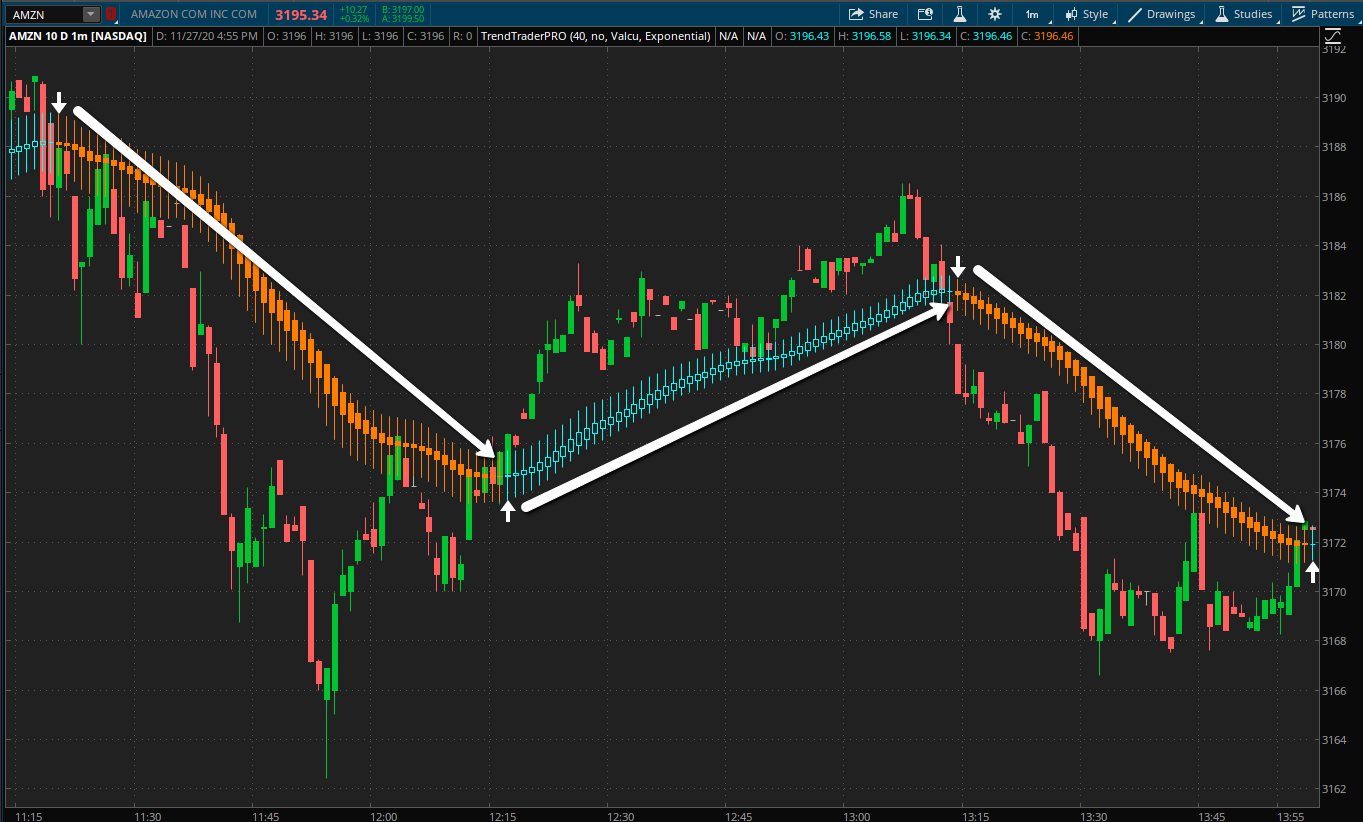
The simplest, easiest way to spot and trade trends on any trading instrument. The AutoTrend System indicator gives you clear trend change signals and keeps you in a trend until the end, capturing the largest part of the move.
The New
Our new DPL indicator is using a mathematical model to divide the price action into specific levels which can act as dynamic support & resistance. These are plotted on your chart automatically and can be uses are reference point when doing your analysis.
- 2
3 -
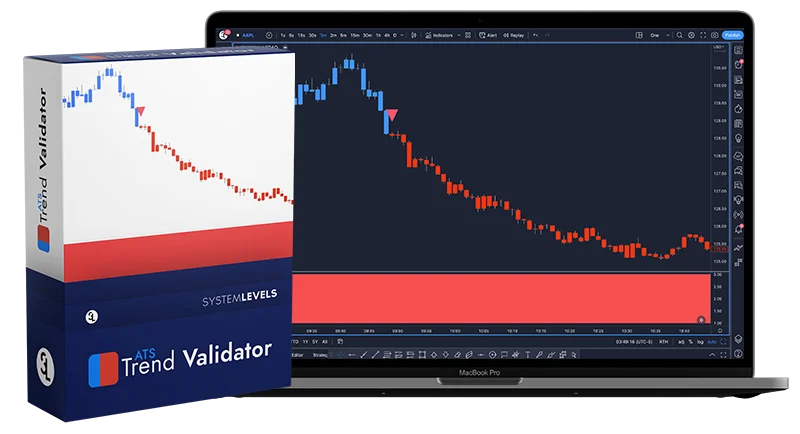
The New
Multi-time frame analysis has always been an integral part of chart reading. The ATS Trend Validator makes easily and simple by displaying the trend of a higher time on the lower part of your chart. So you can easily confirm whether your trade ideas are inline with the higher time frame's trend.
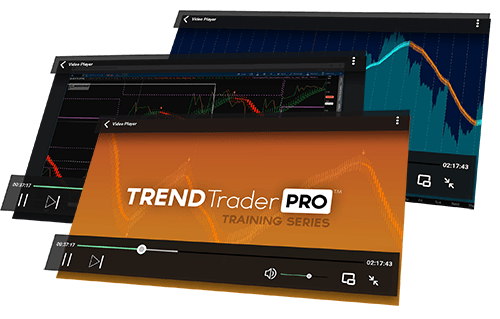
3-Hour Pro Strategy
Training Video Course
All the best tools in the world are useless if you don't know how to use them right. In this 3-hour course will learn how to use AutoTrend System the right way. You are guided through the chart reading process step-by-step so you can start using it from day one.
- 4
Copyright 2024 - System Levels - All Rights Reserved
The information contained on this website is solely for educational purposes, and does not constitute investment advice.
The risk of trading in securities markets can be substantial. You must review and agree to our Disclaimers and Terms and Conditions before using this site.
U.S. Government Required Disclaimer – Commodity Futures Trading Commission. Futures and options trading has large potential rewards, but also large potential risk. You must be aware of the risks and be willing to accept them in order to invest in the futures and options markets. Don’t trade with money you can’t afford to lose. This website is neither a solicitation nor an offer to Buy/Sell futures or options. No representation is being made that any account will or is likely to achieve profits or losses similar to those discussed on this website. The past performance of any trading system or methodology is not necessarily indicative of future results. Individual results may vary, and testimonials are not claimed to represent typical results. Testimonials may not reflect the typical purchaser’s experience, and are not intended to represent or guarantee that anyone will achieve the same or similar results.
System Level's employees will NEVER manage or offer to manage a customer or individual’s options, stocks, currencies, futures, or any financial markets or securities account.
If someone claiming to represent or be associated with System Levels solicits you for money or offers to manage your trading account, do not provide any personal information and contact us immediately.
CFTC RULE 4.41 – HYPOTHETICAL OR SIMULATED PERFORMANCE RESULTS HAVE CERTAIN LIMITATIONS. UNLIKE AN ACTUAL PERFORMANCE RECORD, SIMULATED RESULTS DO NOT REPRESENT ACTUAL TRADING. ALSO, SINCE THE TRADES HAVE NOT BEEN EXECUTED, THE RESULTS MAY HAVE UNDER-OR-OVER COMPENSATED FOR THE IMPACT, IF ANY, OF CERTAIN MARKET FACTORS, SUCH AS LACK OF LIQUIDITY, SIMULATED TRADING PROGRAMS IN GENERAL ARE ALSO SUBJECT TO THE FACT THAT THEY ARE DESIGNED WITH THE BENEFIT OF HINDSIGHT. NO REPRESENTATION IS BEING MADE THAT ANY ACCOUNT WILL OR IS LIKELY TO ACHIEVE PROFIT OR LOSSES SIMILAR TO THOSE SHOWN.